Debut: April 2, 2009. Revision No. 1.
Visitors:
|
This page allows viewing of a multidose pharmacokinetics
profile.
To use enter the following parameters: Loading Dose:
Start
with a
loading dose of zero. A suggested
loading dose will be given in the results text field. The
value of the
Loading Dose is added to the Repeating Dose for the value
of the total
first dose. Repeating Dose:
This
is the
dose given at each
interval, including the first dose.
If you want to examine a single dose, set the Loading Dose
to zero,
keep this as the single dose and set the Dose Interval to
a
ridiculously large number. Dose Interval:
This is
the
time interval between doses. Generally a
dose interval is chosen to be approximately equal to the
elimination
half-life.
If you want to see what a single, non-repeating dose looks
like, set
the Dose Interval to a ridiculously large number, say
10,000 hours. Duration: This is
the
duration of the pharmacokinetics profile that
will be displayed. t 1/2 abs: This
is the
absorption half-life. For an immediate release dosage
form, an
absorption half-life is usually about 0.5 to 1.0 hours.
For sustained
release dosage forms, the absorption half-life may be
about 2 to 3
hours. The absorption rate, ka, is related to the
half-life by ka =
ln(2)/(t 1/2 abs). To mimic an intravenous bolus dose, set
the t 1/2
abs to a very small number, say 0.001 hr. To mimic
continuous infusion,
set the t 1/2 abs to a very low number and set the Dose
Interval to a
similarly small number. t 1/2 elim: This
is
the
elimination half-life. The elimination rate, ke, is
related to the
half-life by ke = ln(2)/(t 1/2 elim). Because of a quirk
in the
mathematics, don't set the absorption and elimination
half-lives equal
to each other. When determining ke and ka from blood data,
something
horrible called flip-flop kinetics occurs if ke is greater
than ka. But
that horribleness does not carry over to this calculation,
so relax. Vd: This is the
volume
of
distribution. You only need to know this if you want exact
values for
blood levels. f: This is the
fraction of
drug absorbed or the bioavailability. You only need to
know this if you
want exact values for blood levels. After you hit the Replot! button, the PK profile is
replotted
and
the text of the data is inserted into the text box. The
text starts off
with a rehash of the input data and includes calculation
of ka, ke and
clearance. The Clearance
is
calculated as the product of ke and Vd. The text then provides values resulting from the first
dose.
This
does not include the Loading Dose, just the amount in the
Repeating
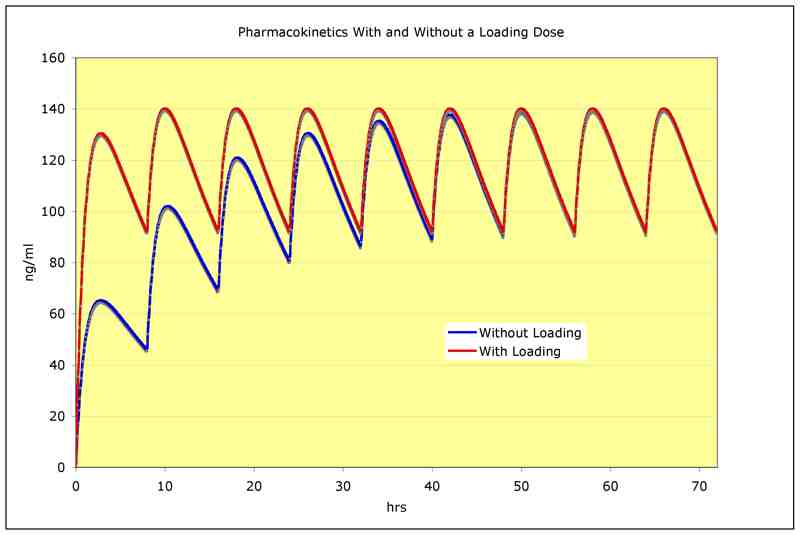
Dose. The next part gives the long-term steady-state values. The Suggested Loading
Dose
is that amount which when added to the Repeating Dose
brings the
initial peak up to the steady state level. Again, the
Loading Dose in
this calculation is the amount added to the Repeating Dose
for the
initial dose. Lastly, the time (t)
and
blood level (Cp)
data are
given. These data may be copied and pasted into an Excel
or Google
spreadsheet for better control over graphing, or for
displaying
multiple curves on the same graph. Here's an example comparing a multidose pharmacokinetics profile with and without a loading dose. |
Other pages
by Jeffrey Clymer. Email.
Debut: April 2, 2009. Revision No. 1.
Visitors: